Wednesday, September 24, 2014

HUGE news NEVADA! The Nevada Housing Division launched a new grant program this week. You might qualify for a FREE cash down payment equal up to 4% a portion of your loan amount. 

On September 22, 2014, the Nevada Housing Division launched a new grant program for homebuyers, known as Home is Possible. For qualified homeowners in Clark and Washoe counties, Home is Possible provides a grant of up to 4 percent of the loan amount to be applied toward the cost of down payments and/or closings. The grants are available immediately for homebuyers that are financing a permanent residence with a government insured FHA, USDA (Rural) or VA mortgage. In November, the program will become available to borrowers who are seeking conventional financing. In order to qualify for Home is Possible, the future homeowner must meet  a few requirements: 1) They must have a minimum credit score of 640 for government insured loans, 660 for manufactured homes and 680 for conventional loans. 2) The home must be purchased as the primary residence, the purchase price must be under $400,000, and 3) the qualifying income on the mortgage application must be less than $95,000 annually. The buyer must also enroll in an approved homebuyer education course. 

Many Las Vegas residents may be eligible to take advantage of this new extended offer by the Nevada Housing Division along with other down payment assistance programs available.  We will help qualified buyers receive a free cash down payment grant equal to 4% of the loan amount.  For more information about this exciting opportunity and Down Payment Assistance, contact Aundrea and The Beach-Greco Team by calling 702-326-7866 emailing us info@aundreabeach.com or visiting www.iLendLasVegas.com

Sunday, September 14, 2014

Markets in a Minute For the Week Ending September 12, 2014

Please enjoy this quick update on what’s happening this week in the housing and financial markets.


The Labor Department's monthly job openings report showed little change in July. Fed policy is likely to remain on its current course in response.

Consumers charged more to credit cards and financed more autos in July. Generally, increased borrowing shows confidence in the economy.

At the same time, U.S. households have stashed $2.15 trillion in savings, about 50% more than five years ago.

Our clients have been getting great rates and service from Jason and Farmers. I bet they can Save you Money on a new policy or your current policy!
One of our partners is Farmers Insurance - Agent Jason Prindl - cell 702-612-2681 or office 702-363-6900 - jason.jhaas@farmersagency.com
Jason joined the Joseph Haas Farmers Insurance Agency in 2007 and handles Auto, Home and Commercial products. Jason, who is originally from Wisconsin, has two children, Henry (9) and Ellie (6). Due to his Mid-West upbringing, Jason is never too busy to do a house appointment or meeting after hours as customer service rates high on his list!

Cash sales as a percentage of home purchases continue to fall. The rate is at the September 2008 level and likely is a result of the dwindling REO supply.

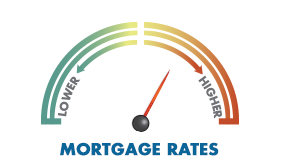
A typical seasonal slowdown is showing in the Fannie Mae household survey and mortgage application index. Yet rates remain very low, and affordability still reigns.

Almost half of millennials say they expect to buy a home in the near future. 97% of teens expect to become homeowners one day. 

A businessman on his deathbed called his friend and said, "Bill, I want you to promise me that when I die you will have my remains cremated."
"And what," his friend asked, "do you want me to do with your ashes?"
The businessman said, "Just put them in an envelope and mail them to the Internal Revenue Service. Write on the envelope, 'Now, you have everything.'"


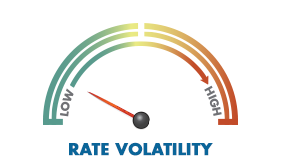
Rate movements and volatility are based on published, aggregate national averages and measured from the previous to the most recent midweek daily reporting period. These rate trends can differ from our own and are subject to change at any time.
    

Wednesday, September 10, 2014

HUD's new HAWK program

HUD is rolling out a new program:  Homeowners Armed With Knowledge (HAWK) that provides FHA insurance pricing incentives to first-time homebuyers which is defined as anyone that has not owned a home in the last 3 years.  Six hours of pre-contract counselling is required with one hour pre-closing and one hour post-closing.
You can see Frank and Brian's video about this program by clicking here.

Friday, August 08, 2014

Mortgage Market Update Week Ending August 8, 2014


Please enjoy this quick update on what’s happening this week in the housing and financial markets.


The U.S. services sector reached its highest level in 8+ years, and factory orders surged in June. Economic growth could lead to increased rates.

The economic growth could speed up Fed policy changes. However, growth is balanced with other factors including inflation, which is holding steady.

European economic woes and geopolitical events are contributing to downward movement in stocks. Rates are stable near their recent lows.

CoreLogic reports home prices up in June for the 28th consecutive month, though rising at a slower pace. Nationally, prices are still 9% below the peak.

NAHB found a $1000 increase in national median new home prices will take more than 200,000 potential homebuyers out of the market.

Much has been said about student loan debt's negative affect on first time buyers. Remember, it's not the balance that matters; it's the payment amount.

Mary decided to trim her household budget wherever possible. Instead of having her dress dry-cleaned, she washed it by hand.
Proud of her savings, she boasted to her husband, "Just think, Tom, we are five dollars richer because I washed this dress by hand."
"Good," Tom said. "Quick, wash it again!"


Rate movements and volatility are based on published, aggregate national averages and measured from the previous to the most recent midweek daily reporting period. These rate trends can differ from our own and are subject to change at any time.

Can You Afford a Home If Mortgage Rates Jump By 1 Percentage Point? Here’s the Answer.

Interest rates are likely to rise steadily into next year, and a full percentage point increase is not out of the question.

The real estate site Zillow did some research to answer the question: Can you afford to wait and buy a home if rates go up by a percentage point?

Zillow applied next year’s forecast home values and a 1 percentage point interest rate increase to the median home price in 35 U.S. metro areas. Zillow then calculated the difference in mortgage payments.  The results for some areas are striking.

Of course, the higher the home prices, the bigger the monthly payment jump. For example, in San Francisco, a percentage point increase means $556 more a month.
“More often than not, buyers do not understand the profound effect of rising interest rates on affordability,” said Erin Lantz, vice president of mortgages at Zillow. “Many buyers associate a 1 percentage point interest rate change with a 1 percent change on a piece of clothing or the price of a car, when in fact they are very different.”

As a rule of thumb,  a 1 percentage point increase in mortgage rates reduces affordability by 10 percent.
See the graphic below for the results:
Mortgage1Percent_Zillow_Aug2014

Don't wait to buy a home and get priced out of the market. We have loan programs for just about every buyer and every need.  
Contact us today 702-326-7866
info@aundreabeach.com
www.iLendLasVegas.com

Tuesday, August 05, 2014

Mortgage Market Update Week Ending August 1, 2014


Week Ending 8-1-14

Please enjoy this quick update on what’s happening this week in the housing and financial markets.


The Fed says it will not raise policy rates until a "considerable time" after ending the taper in October. Housing and some labor indicators still cause concern.

Second quarter GDP surprised with a 4.0% gain, more than making up for the first quarter drop. Rates jumped to their high for the month.

Consumer confidence is at a 7-year high, possibly inspired by higher employment and low inflation. If the economy improves, rates will likely go up. 

June's pending home sales were healthy but down slightly. The three previous months saw increases. Pending sales are still above normal.

May's home prices rose over last month and last year. Case-Schiller's survey found a seasonally adjusted decline in prices, possibly impacted by foreclosures. 

Homeownership rates have hit a 19-year low. The resulting rental demand has driven residential rental vacancies to long-term lows too. 

I have all the money I'll ever need...if I die by 4 p.m. tomorrow.


Rate movements and volatility are based on published, aggregate national averages and measured from the previous to the most recent midweek daily reporting period. These rate trends can differ from our own and are subject to change at any time.

Saturday, July 26, 2014

Las Vegas economy and real estate market update

The Las Vegas economy and real estate market continue to improve and are expected to gain momentum with over $6 billion in new investments around the Strip corridor over the next three years.
We continue to be optimistic on north strip high-rise opportunities in the $350k and under segment due to the new north strip developments. Turnberry Towers is already seeing increases in rents and sale prices, largely due to the new SLS project opening next door.

Promotions in High-Rise: 
  • The Martin is sold out and releasing their models for sale.
  • Turnberry Towers has select residences offering 1 year of HOA’s paid.
  • Our office is the only office to offer 1 year of HOA’s paid on select penthouses at Mandarin.
 
Promotions in Residential:
 
The guard gated, golf community of the Masters in Southern Highlands is offering homes with approximately 4000 sf in the $600k’s and interest rates as low as 3.75%. These residences would likely rent at $3500+ with HOA’s below $300/month. Only 29 homesites left, contact us if you are interested luxury residential opportunities.


The following is a list of articles, stats, and community statistics for the majority of communities in Las Vegas.

Nevada’s jobless numbers fall to lowest level in five years.
http://www.vegasinc.com/business/2014/jul/18/nevadas-jobless-numbers/

MGM Resorts, Cirque to build 33-acre, open-air venue to host Rock in Rio in Las Vegas.
http://lasvegassun.com/vegasdeluxe/2014/apr/21/rock-rio-headed-las-vegas-mgm-resorts-cirque-build/

Las Vegas visitor volume jumps 3.2% in May.
http://www.reviewjournal.com/business/tourism/las-vegas-visitor-volume-jumps-32-percent-may

Home prices rising, but still a ways to go.
http://www.vegasinc.com/business/real-estate/2014/jul/21/las-vegas-home-values-are-rising/

Downtown Summerlin, will serve the entire Las Vegas Valley with over 125 shops and restaurants in an open-air shopping environment. (Opening 10/14)
http://downtownsummerlin.com/
  • May’s visitor volume climbed 3.2% from last year to 3.6 million people.
  • Average daily room rate in May was up 8% to $127.60
  • Convention attendance was up 14% to 454,163.
  • Visitor volume through five months is up 4.5% to 17.2 million people.
  • Strip occupancy/first five months is up 2.6% to 90% while downtown is up 6% to 79%.

Dollar value in projects scheduled to open in the Las Vegas area:

  • 2015- $1,254,350,000
  • 2016-  $538,700,000
  • 2017- $4,000,500,000

Stats on Communities in Vegas:
Allure

  • Average Sale $243,833.30
  • $PPSF $213.00
  • Average Monthly Rental Price $1,601.00
  • Average Yearly Rental Price $19,212.00
  • Average Rental Days On Market 52
  • Average Rental Price/SF $1.37
  • Yearly Rent Vs. Average Sale % 7.88%
  • Total Sales 6


Martin
 
  • Average Sale  $526,397.92
  • $PPSF  $338.28
  • Average Monthly Rental Price  $2,407.46
  • Average Yearly Rental Price  $28,889.52
  • Average Rental Days On Market  47
  • Average Rental Price/SF  $1.85
  • Yearly Rent Vs. Average Sale %  5.3%
  • Total Sales  12

Mandarin
 
  • Average Sale  $1,472,649.29
  • $PPSF  $668.47
  • Average Monthly Rental Price  $3,508.33
  • Average Yearly Rental Price  $42,099.96
  • Average Rental Days On Market  42
  • Average Rental Price/SF  $2.68
  • Yearly Rent Vs. Average Sale %  2.9%
  • Total Sales  14

Panorama
 
  • Average Sale  $361,911.50
  • $PPSF  $272.31
  • Average Monthly Rental Price  $2,331.46
  • Average Yearly Rental Price  $27,977.52
  • Average Rental Days On Market  41
  • Average Rental Price/SF  $1.53
  • Yearly Rent Vs. Average Sale %  7.73%
  • Total Sales  12

Sky
 
  • Average Sale  $318,642.85
  • $PPSF  $239.89
  • Average Monthly Rental Price  $1,858.00
  • Average Yearly Rental Price  $22,296.00
  • Average Rental Days On Market  $101.39
  • Average Rental Price/SF  $6.91
  • Yearly Rent Vs. Average Sale %  7.00%
  • Total Sales  7

Turnberry Place
 
  • Average Sale  $516,200.00
  • $PPSF  $215.08
  • Average Monthly Rental Price  $2,555.00
  • Average Yearly Rental Price  $30,660.00
  • Average Rental Days On Market  94
  • Average Rental Price/SF  $1.20
  • Yearly Rent Vs. Average Sale %  5.8%
  • Total Sales  12

 Turnberry Towers
 
  • Average Sale  $396,066.62
  • $PPSF  $292.65
  • Average Monthly Rental Price  $1,824.73
  • Average Yearly Rental Price  $21,896.76
  • Average Rental Days On Market  91
  • Average Rental Price/SF  $1.79
  • Yearly Rent Vs. Average Sale%  5.5%
  • Total Sales  13

Veer
 
  • Average Sale  $561,972.86
  • $PPSF  $564.00
  • Average Monthly Rental Price  $1,858.94
  • Average Yearly Rental Price  $22,307.28
  • Average Rental Days On Market  52
  • Average Rental Price/SF  $2.23
  • Yearly Rent Vs. Average Sale%  3.44%
  • Total Sales  35

Aliante
 
  • Average Sale  $231,378.41
  • $PPSF  $101.22
  • Average Monthly Rental Price  $1,278.48
  • Average Yearly Rental Price  $15,341.76
  • Average Rental Days On Market  33
  • Average Rental Price/SF  $0.66
  • Yearly Rent Vs. Average Sale%  6.63%
  • Total Sales  113

Anthem
 
  • Average Sale  $414,472.40
  • $PPSF  $162.06
  • Average Monthly Rental Price  $2,224.65
  • Average Yearly Rental Price  $26,695.80
  • Average Rental Days On Market  47
  • Average Rental Price/SF  $0.91
  • Yearly Rent Vs. Average Sale %  6.44%
  • Total Sales  113

Green Valley
 
  • Average Sale  $242,986.70
  • $PPSF  $117.53
  • Average Monthly Rental Price  $1,372.90
  • Average Yearly Rental Price  $16,474.80
  • Average Rental Days On Market  34
  • Average Rental Price/SF  $0.84
  • Yearly Rent Vs. Average Sale %  6.78%
  • Total Sales  178

Inspirada
 
  • Average Sale  $257,898.06
  • $PPSF  $123.87
  • Average Monthly Rental Price  $1,506.28
  • Average Yearly Rental Price  $18,075.36
  • Average Rental Days On Market  42
  • Average Rental Price/SF  $0.75
  • Yearly Rent Vs. Average Sale %  7.01%
  • Total Sales  31

Las Vegas CC
 
  • Average Sale  $153,127.69
  • $PPSF  $100.64
  • Average Monthly Rental Price  $1,398.33
  • Average Yearly Rental Price  $16,779.96
  • Average Rental Days On Market  31
  • Average Rental Price/SF  $0.80
  • Yearly Rent Vs. Average Sale %  10.96%
  • Total Sales  26

Mountains Edge
 
  • Average Sale  $252,409.70
  • $PPSF  $116.64
  • Average Monthly Rental Price  $1,468.40
  • Average Yearly Rental Price  $17,620.80
  • Average Rental Days On Market  29
  • Average Rental Price/SF  $0.69
  • Yearly Rent Vs. Average Sale %  6.98%
  • Total Sales  220

Peccole Ranch
 
  • Average Sale  $231,020.76
  • $PPSF  $121.67
  • Average Monthly Rental Price  $1,535.00
  • Average Yearly Rental Price  $18,420.00
  • Average Rental Days On Market  29
  • Average Rental Price/SF  $0.74
  • Yearly Rent Vs. Average Sale %  7.97%
  • Total Sales  46

Queensridge
 
  • Average Sale  $896,205.88
  • $PPSF  $200.40
  • Average Monthly Rental Price  $8,277.14
  • Average Yearly Rental Price  $99,325.68
  • Average Rental Days On Market  50
  • Average Rental Price/SF  $2.00
  • Yearly Rent Vs. Average Sale %  11.08%
  • Total Sales  17

Red Rock CC
 
  • Average Sale  $875,470.58
  • $PPSF  $238.41
  • Average Monthly Rental Price  $3,804.00
  • Average Yearly Rental Price  $45,648.00
  • Average Rental Days On Market  $94.80
  • Average Rental Price/SF  $1.10
  • Yearly Rent Vs. Average Sale %  5.21%
  • Total Sales  17

Rhodes Ranch
 
  • Average Sale  $316,619.27
  • $PPSF  $137.89
  • Average Monthly Rental Price  $1,750.22
  • Average Yearly Rental Price  $21,002.64
  • Average Rental Days On Market  40
  • Average Rental Price/SF  $0.72
  • Yearly Rent Vs. Average Sale %  6.63%
  • Total Sales  59

Southern Highlands  
 
  • Average Sale  $364,557.93
  • $PPSF  $126.39
  • Average Monthly Rental Price  $1,556.58
  • Average Yearly Rental Price  $18,678.96
  • Average Rental Days On Market  32
  • Average Rental Price/SF  $0.72
  • Yearly Rent Vs. Average Sale %  5.12%
  • Total Sales  131

Summerlin
 
  • Average Sale  $376,676.21
  • $PPSF  $151.62
  • Average Monthly Rental Price  $1,696.56
  • Average Yearly Rental Price  $20,358.72
  • Average Rental Days On Market  33
  • Average Rental Price/SF  $0.86
  • Yearly Rent Vs. Average Sale %  5.40%
  • Total Sales  408

This data is from the MLS and may not include non-MLS/developer sales and is not guaranteed. If you would like a specific report from these communities, please contact us.

If we can assist you with buying, selling, or managing Las Vegas real estate, please contact us.